
Case Study: Tracking Rainfall and Soil Moisture
Kicking off a simple, affordable water management case study that can be deployed on any farm this spring
Recently I’ve been working toward a simple case study to demonstrate a real-world application of the HTH system. The goal here is to put together a small, practical setup that answers a constant question on my farm:
When do I need to water the garden?
For now, I’m only tracking water at a single depth, however in theory it would also be possible to extend the study with an additional sensor buried 12 inches deeper to estimate soil-water infiltration rates.
What I’m Tracking
The system is currently tracking a handful of key parameters:
Total rainfall over a given period
Soil moisture using both a Vegetronix VH400 and a Teros11 sensor
Soil temperature from the Teros11
As we move out of the rainy season, I plan to expand this to include water applied through irrigation using a pulse-counting water meter.
Sensor Placement and Installation
The rain gauge is installed near the garden. The soil sensors are buried at roughly 4 inches deep, placed near where I plan to plant tomatoes later this spring.
To install them, I dug a small trench and inserted the sensors horizontally into the mostly undisturbed sidewall at the target depth. After that, I backfilled the trench and packed the soil back down as best I could.


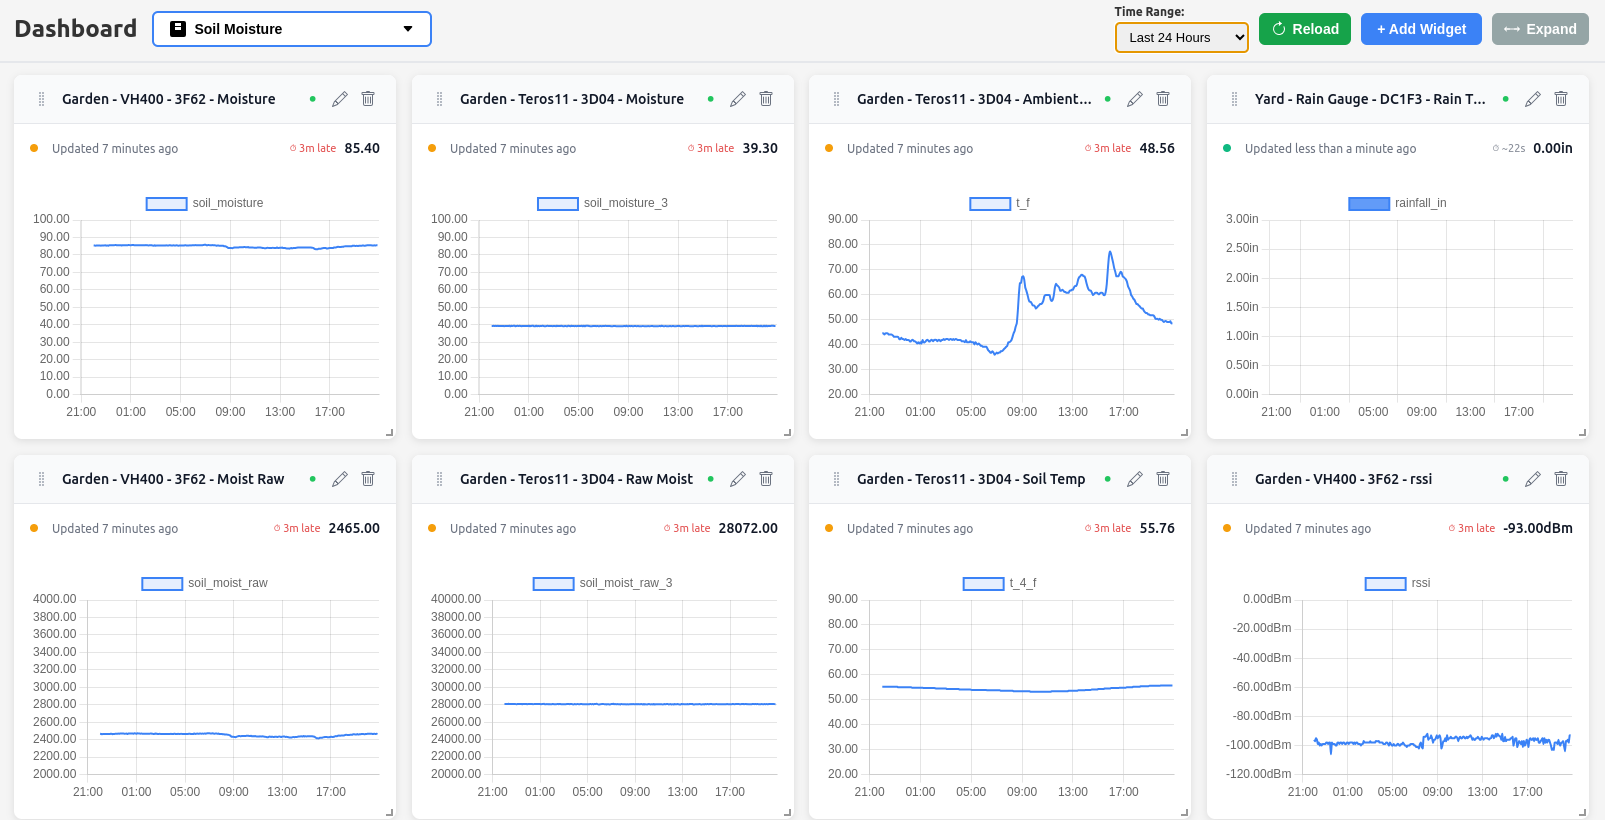
Data Collection
Once everything was in the ground, I set up a simple dashboard to track the incoming data. The sensors are set up to send updates every 5 minutes. Each update includes:
A calculated volumetric water content (VWC) percentage
The raw sensor readings for ambient temperature, soil temperature, and soil moisture
I’m intentionally recording both raw and calculated values from each update. The calculated values are useful in the moment for graphing real-time data, but the raw data gives me the option to revisit more advanced calibration approaches later if needed.
Calibration Approach
For the VH400, I’m currently using a naive linear interpolation to convert from raw sensor voltages to volumetric water content (VWC). Zero percent is based on dry air readings, and one hundred percent is based on the sensor fully immersed in water. The actual math and physics here is far more complex than this simple formula provides, so I don’t expect to get super accurate absolute VWC readings from this sensor initially. Even without absolute samples, I should still be able to see relative moisture changes and will be able to determine a point where the soil is wet enough and when the soil is drying out. Vegetronics does provide a detailed VWC curve on their website and once I have collected a series of raw samples, I’ll run it through that equation and compare to the calibrated Teros 11 readings.
For the Teros11, I’m using the standard mineral soil calibration from the user manual:
VWC = (3.879e-4 × RAW) - 0.6956
I’m not entirely confident that I have the order of operations implemented correctly, but the initial numbers look reasonable. Since I’m logging the raw values alongside the computed values, I can revisit this later without losing anything.
Case Study Objective
The main goal of this case study is to demonstrate that a system built on the HTH platform can be deployed quickly and start producing useful data without a lot of overhead.
If this works the way I expect, it should give a clear picture of:
How water moves through the soil over time
How well the soil retains moisture after rainfall
How to better time and size irrigation events through the dry season
When is the soil “workable” for spring plantings and reliable germination
All of these data points come together to provide information and empower farmers and land managers to make informed decisions about when to plant and when and how long to irrigate.
Where Things Stand
The sensors have been in the ground for just over a day, and there haven’t been any rain events yet. So there isn’t much actual data to analyze at this point.
What is worth noting is how quickly this whole thing has come together using the HiTechHomestead Toolkit and end-device firmware. It took a couple of days to get the sensors integrated into the firmware, but once I had them reliably reading data, getting that data onto the HTH dashboard and devices wired up only took a couple hours.
So far, things are behaving the way I would expect. The system is up and running, and data is coming in consistently.
Now it’s just a matter of letting it run and seeing what the data shows. If you want to follow along or even try to reproduce this case study on your own farm, subscribe for future updates and I’ll let you know when the HTH Toolkit Simple LoRa stage is ready for testing.